CPU Utilization & CPU Capacity
Hi Friends,
This seminar was designed and presented by Craig Shallahamer.
I would strongly recommend these seminars for all DBAs & SysAdmins who wants to become a super DBA/SysAdmin, hereby sharing the power packed sample of how Craig Shallahamer explains the contents. End of the day, You will feel like a mathematician playing with numbers.
(1) What Is Utilization?
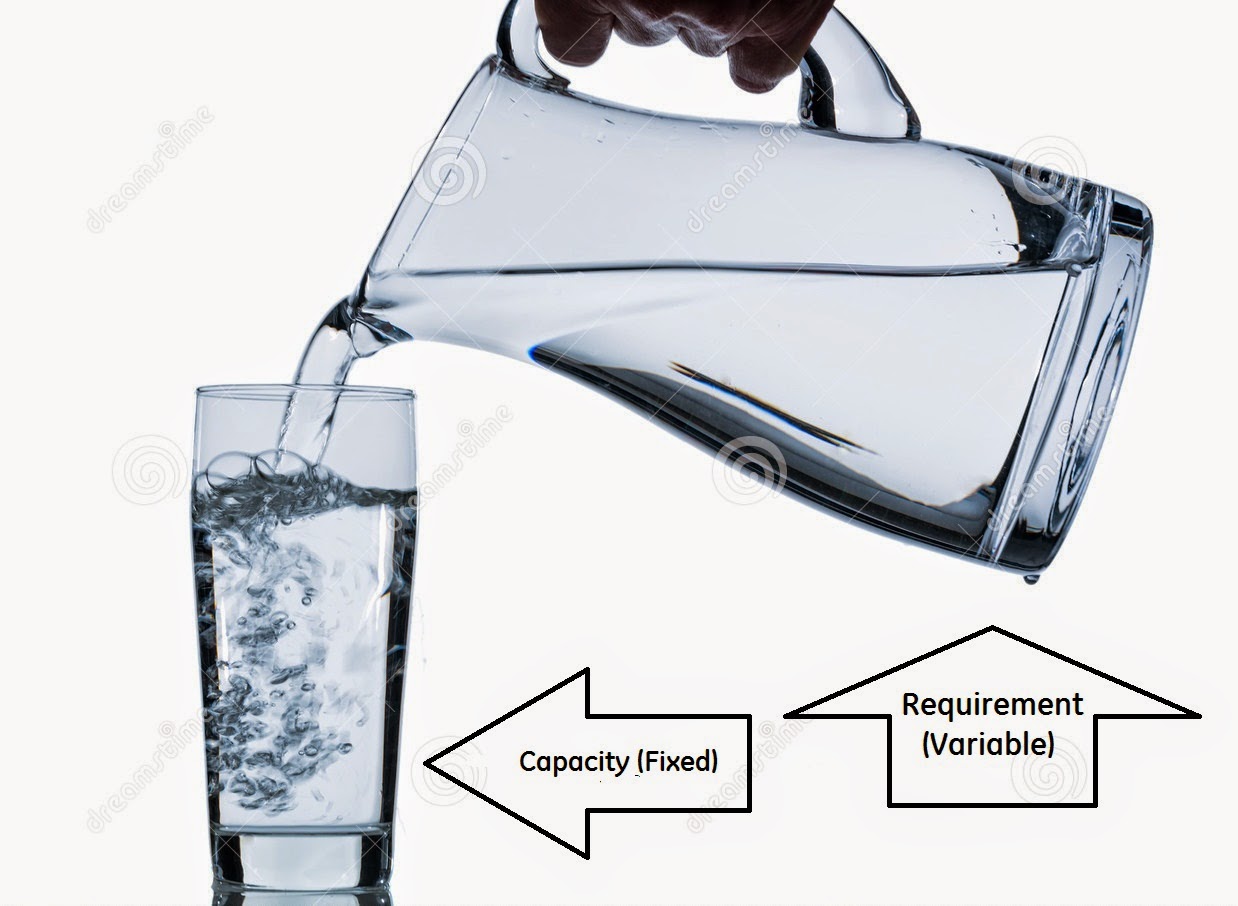
Utilization (U) = Requirement(R)/Capacity(C) = 500ML/700ML = 0.71 = 71%
(The glass seems to be filled by 71%, The pic is for representation only)
Busy% + idle% = 100
User % + System% + wio% = 100
User% + Nice% + System% + Steal% + wio% = 100
- NICE TIME= When a process is nice-ed, its priority is large-ed, So it is nicer to other processes
- STEAL TIME=Virtual machine has stolen or given more time from another VM
- IDLE TIME= CPUs are idle sometimes waiting for an IO (wio)
(2) Where OS tools Collect Performance Data?
Common OS tools:-
Note:- SAR is not default, systat rpm should be install.
•sar -u 3 9
•vmstat 3 9
•top
Where do these tools get the raw data from?
strace vmstat 2 3
•For IO - IOSTAT
•For Memory - SAR
•For Network -NETSTAT
(3) How Oracle Database Collects The Server Metrics?
• STRACE is a debugging utility for Linux and some other Unix-like systems to monitor the system calls used by a program and all the signals it receives, similar to "truss" utility in other Unix systems. This is made possible by a kernel feature known as ptrace.
•
• MMNL The Memory Monitor Light (MMNL) process is a new process from 10g and higher versions which works with the Automatic Workload Repository new features (AWR) to write out full statistics buffers to disk as needed.
[ajithpathiyil1:oracle]> ps -ef|grep mnl
oracle 3334 1 0 Mar 22 ? 188:00 ora_mmnl_ajithrac1
oracle 21355 16615 0 08:26:34 pts/15 0:00 grep mnl
[ajithpathiyil1:oracle]>
[ajithpathiyil1:oracle]> strace -p 3334 3>&1 2>&1 |grep '/proc/stat'
• The file number was 15 and the reopen cycled every 15 seconds
[ajithpathiyil1:oracle]> strace -p 3334 3>&1 2>&1 |grep 'read(15, "cpu'
• The file number was 15 and the read occured every 15 seconds
(4) Simulate SAR – Using /proc FS
#/bin/ksh
#Sample Shell Script :- cpuinfo.sh
#Usage:- [ajithpathiyil1:oracle]> ./cpuinfo.sh
#Author:- Craig Shallahamer
interval=$1
echo "user nice system wio idle“
while [ 1 = 1 ]
do
cpu_all_t0=`cat /proc/stat |head -1`
cpu_usr_t0=`echo $cpu_all_t0 |awk'{print $2}'`
cpu_nic_t0=`echo $cpu_all_t0 |awk'{print $3}'`
cpu_sys_t0=`echo $cpu_all_t0 |awk '{print $4}'`
cpu_idl_t0=`echo $cpu_all_t0 |awk '{print $5}'`
cpu_wio_t0=`echo $cpu_all_t0 |awk '{print $6}'`
sleep $interval
cpu_all_t1=`cat/proc/stat |head -1`
cpu_usr_t1=`echo $cpu_all_t1 | awk '{print $2}'`
cpu_nic_t1=`echo $cpu_all_t1 | awk '{print $3}'`
cpu_sys_t1=`echo $cpu_all_t1 | awk '{print $4}'`
cpu_idl_t1=`echo $cpu_all_t1 | awk '{print $5}'`
cpu_wio_t1=`echo $cpu_all_t1 | awk '{print $6}'`
usr=`echo $cpu_usr_t1-$cpu_usr_t0 | bc`
nic=`echo $cpu_nic_t1-$cpu_nic_t0 | bc`
sys=`echo $cpu_sys_t1-$cpu_sys_t0 | bc`
idl=`echo $cpu_idl_t1-$cpu_idl_t0 | bc`
wio=`echo $cpu_wio_t1-$cpu_wio_t0 | bc`
tot=`echo $usr+$nic+$sys+$idl+$wio | bc`
usr_pct=`echo "scale=2;$usr/$tot" | bc`
nic_pct=`echo "scale=2;$nic/$tot" | bc`
sys_pct=`echo "scale=2;$sys/$tot" | bc`
idl_pct=`echo "scale=2;$idl/$tot" | bc`
wio_pct=`echo "scale=2;$wio/$tot" | bc`
echo "$usr_pct $nic_pct $sys_pct $idl_pct $wio_pct"
done
(5) Calculating OS CPU Utilization: OraPub Core Method
• OS CPU Utilization using the core method completely from v$ views especially v$osstat.
U=R/C
1 CPU core, 1 minute = 60 Secs
1 CPU core, 2 minute = 120 Secs
2 CPU cores, 1 minute = 120 Secs
2 CPU cores, 2 minute = 240 Secs
• CAPACITY
Elapsed Time(Duration) X CPU cores = Capacity
12 X 3600 Secs = 43200 sec (Of CPU)
24 x 60 X 60 Secs/min = 86400 sec (Of CPU)
• REQUIREMENTS
AWR Report = NUM_CPUS & ELAPSED (60 Mins or 3600 Secs)
num_cpus, cpu_cores, cpu_sockets, vcpus, lcpus, num_cores, num_threads
Note:- AWR- OS Statistics - BUSY_TIME (in centiseconds) divide by 100 to get in secs
Utilization = Requirements / Capacity
= time used / time available
* time used = v$osstat.busy_time /100
= 1913617 cs / 100 = 19136 seconds
* time available = duration X v$osstat.num_cpus
= 60 min X 60 sec/min X 24
= 86400 sec
U = 19136 sec / 86400 sec
= 0.22
= 22% (Average CPU utilization for that 60 min of AWR data)
(5) Calculating OS CPU Utilization : OraPub Busy:Idle Method
Utilization = Requirements / capacity
= time used / time available
* time used = v$osstat.busy_time
= 1913617 cs
* time available = v$osstat.busy_time + v$osstat.idle_time
= 1913617 cs + 7159367 cs
= 9072984 cs
Utilization = 1913617 cs / 9072984 cs
= 0.21
= 21%
Source: Delta values from v$osstat found in all AWR reports
This is Interesting. Just watch this J
1,913,617/(1,913,617 + 7,159,367) = 0.21
1,913/(1,913 + 7,159) = 0.21
19/(19 + 72) = 0.21
(6) Find The True Units of Power In DB Server
True units of power in DB server
U = R/C
= busy_time/(busy_time+idle_time)
- Formula used by OraPub Core method
= busy_time/(duration X units_of_power)
- Formula used by OraPub Busy-Idle method
units_of_power = busy_time+idle_time/duration
If you notice carefully, NUM_CPUS seems to be the actual unit of power in your server.
HAPPY LEARNING!

Comments
Post a Comment